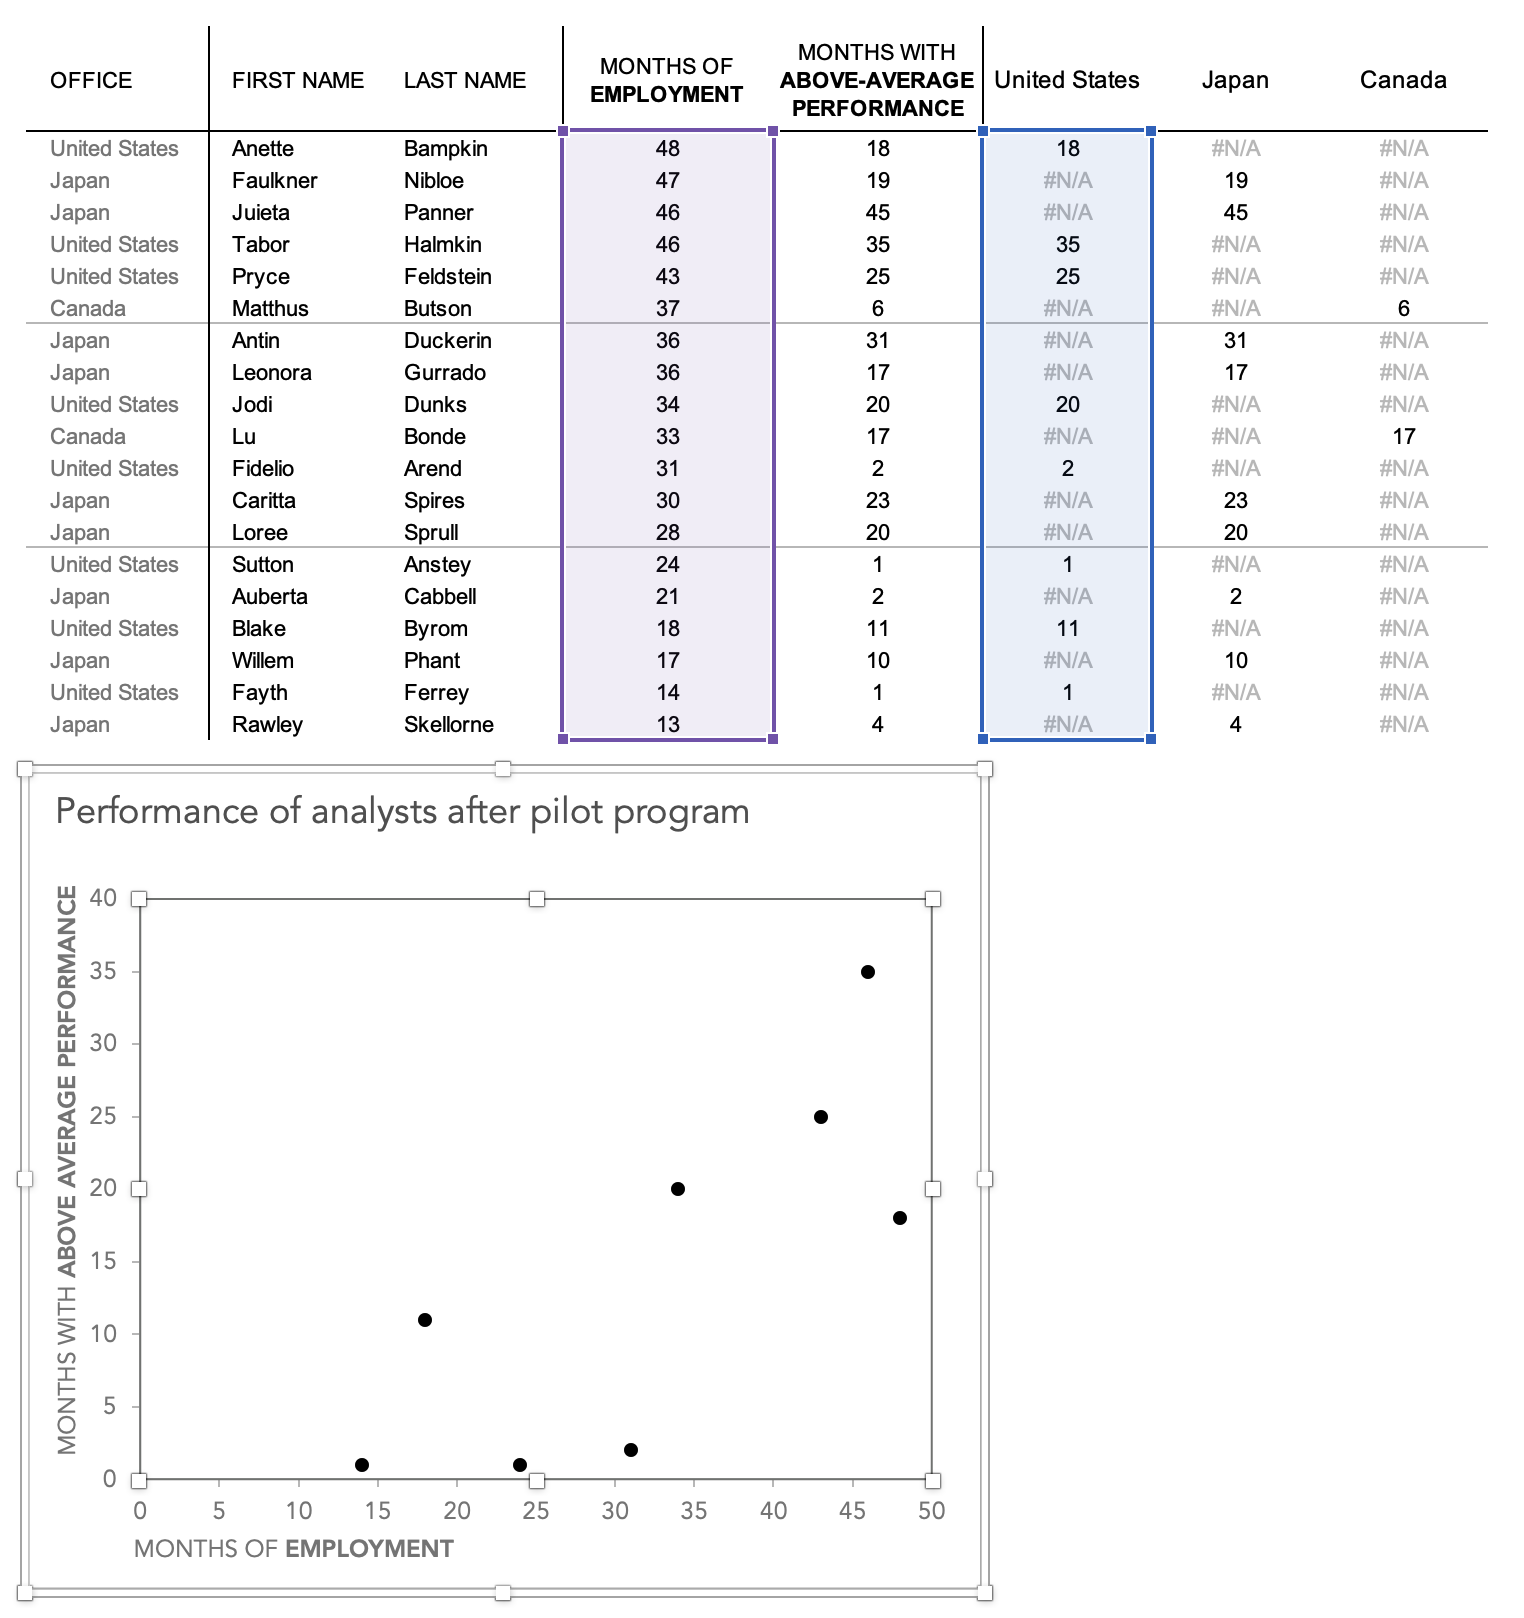
Excel is a powerful tool that can be used to create various types of graphs and charts, including scatter graphs. Scatter graphs are useful for displaying the relationship between two variables and identifying any patterns or trends in the data. In this article, we will discuss how to draw a scatter graph in Excel.
To create a scatter graph in Excel, you will first need to input your data into a spreadsheet. Make sure to organize your data so that one variable is listed in one column and the other variable is listed in another column. Once your data is entered, select the cells containing the data you want to plot.
Next, click on the “Insert” tab in the Excel toolbar and select the “Scatter” option from the charts section. Choose the type of scatter graph you want to create, such as a simple scatter graph or a scatter graph with smooth lines. Excel will then generate a scatter graph based on the data you selected.
You can customize your scatter graph by adding a title, labels for the x-axis and y-axis, and a legend if needed. You can also change the colors and styles of the data points to make them more visually appealing. Excel offers a variety of customization options to help you create a scatter graph that meets your needs.
Once you have customized your scatter graph, you can analyze the data and look for any patterns or trends. Scatter graphs can help you identify correlations between variables, outliers in the data, and any other interesting insights. You can also add trendlines to your scatter graph to help visualize the relationship between the variables more clearly.
In conclusion, drawing a scatter graph in Excel is a simple and effective way to visualize the relationship between two variables. By following the steps outlined in this article, you can create a scatter graph that accurately represents your data and helps you identify any patterns or trends. Excel’s customization options allow you to create a scatter graph that is both informative and visually appealing.
