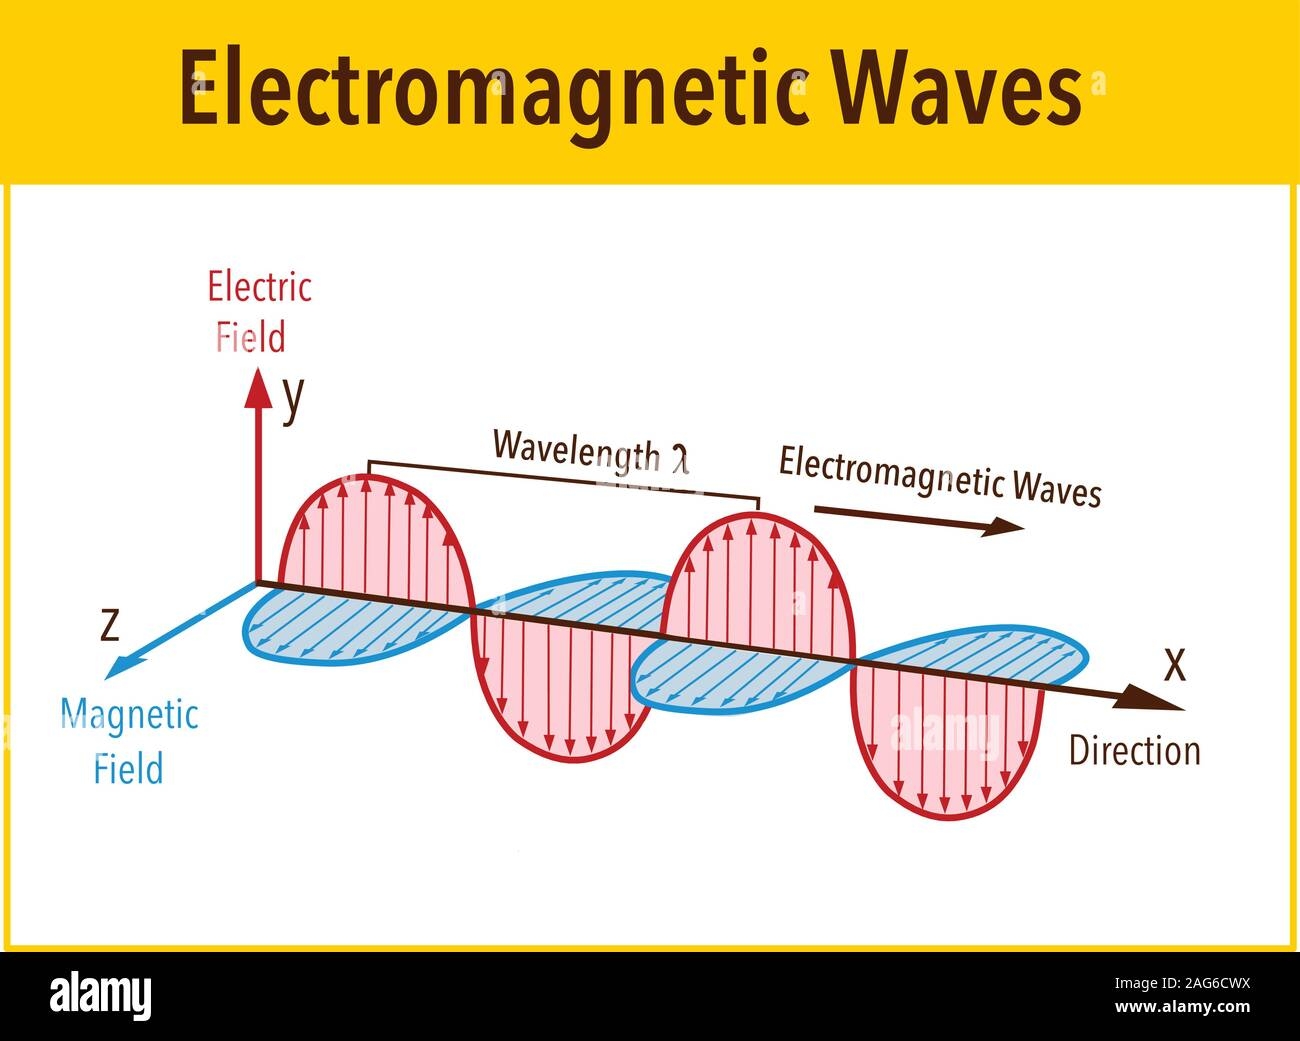
Wave diagrams are a visual representation of how waves move through a medium. They are commonly used in physics and engineering to illustrate concepts such as amplitude, frequency, and wavelength. Drawing a wave diagram may seem daunting at first, but with the right techniques, it can be a straightforward process.
Before diving into drawing a wave diagram, it’s essential to understand the basic components of a wave. Waves are characterized by their amplitude, which is the height of the wave, frequency, which is the number of waves that pass a point in a given time, and wavelength, which is the distance between two corresponding points on a wave.
Draw Wave Diagram:
When drawing a wave diagram, start by sketching a horizontal line to represent the baseline. This will be the starting point for your wave. Next, draw a curved line above the baseline to represent the crest of the wave. The distance between the baseline and the crest is the amplitude of the wave.
After drawing the crest, draw a curved line below the baseline to represent the trough of the wave. The distance between the baseline and the trough is also the amplitude of the wave. Make sure that the crest and trough are symmetrical to each other to accurately represent the wave.
Once you have drawn the crest and trough, indicate the wavelength by measuring the distance between two corresponding points on the wave. This will give you a sense of how long the wave is and how many cycles are present within that length. Additionally, you can label the wave diagram with the frequency of the wave to provide more information about its characteristics.
Finally, you can add arrows to the wave diagram to indicate the direction in which the wave is propagating. This will help viewers understand how the wave is moving through space and interacting with its surroundings. Once you have completed these steps, you will have a clear and accurate wave diagram that effectively conveys the properties of the wave.
In conclusion, drawing a wave diagram is a valuable skill that can help you visualize and understand the behavior of waves. By following the steps outlined above and paying attention to details such as amplitude, wavelength, and frequency, you can create informative and visually appealing wave diagrams that enhance your understanding of wave phenomena.
